
Ethereum (ETH) is entering a crucial phase as the MVRV Z-Score – a key indicator for assessing ETH’s valuation – has dropped to a 17-month low. This has raised expectations of a strong recovery for the world’s second-largest cryptocurrency, similar to what has happened in the past.
Ethereum Approaches Strong Accumulation Zone
The MVRV Z-Score is an indicator that measures the difference between Ethereum’s market value and its intrinsic value. When the indicator enters the green zone, it indicates that ETH is undervalued, and history has shown that this is often a good time to accumulate.
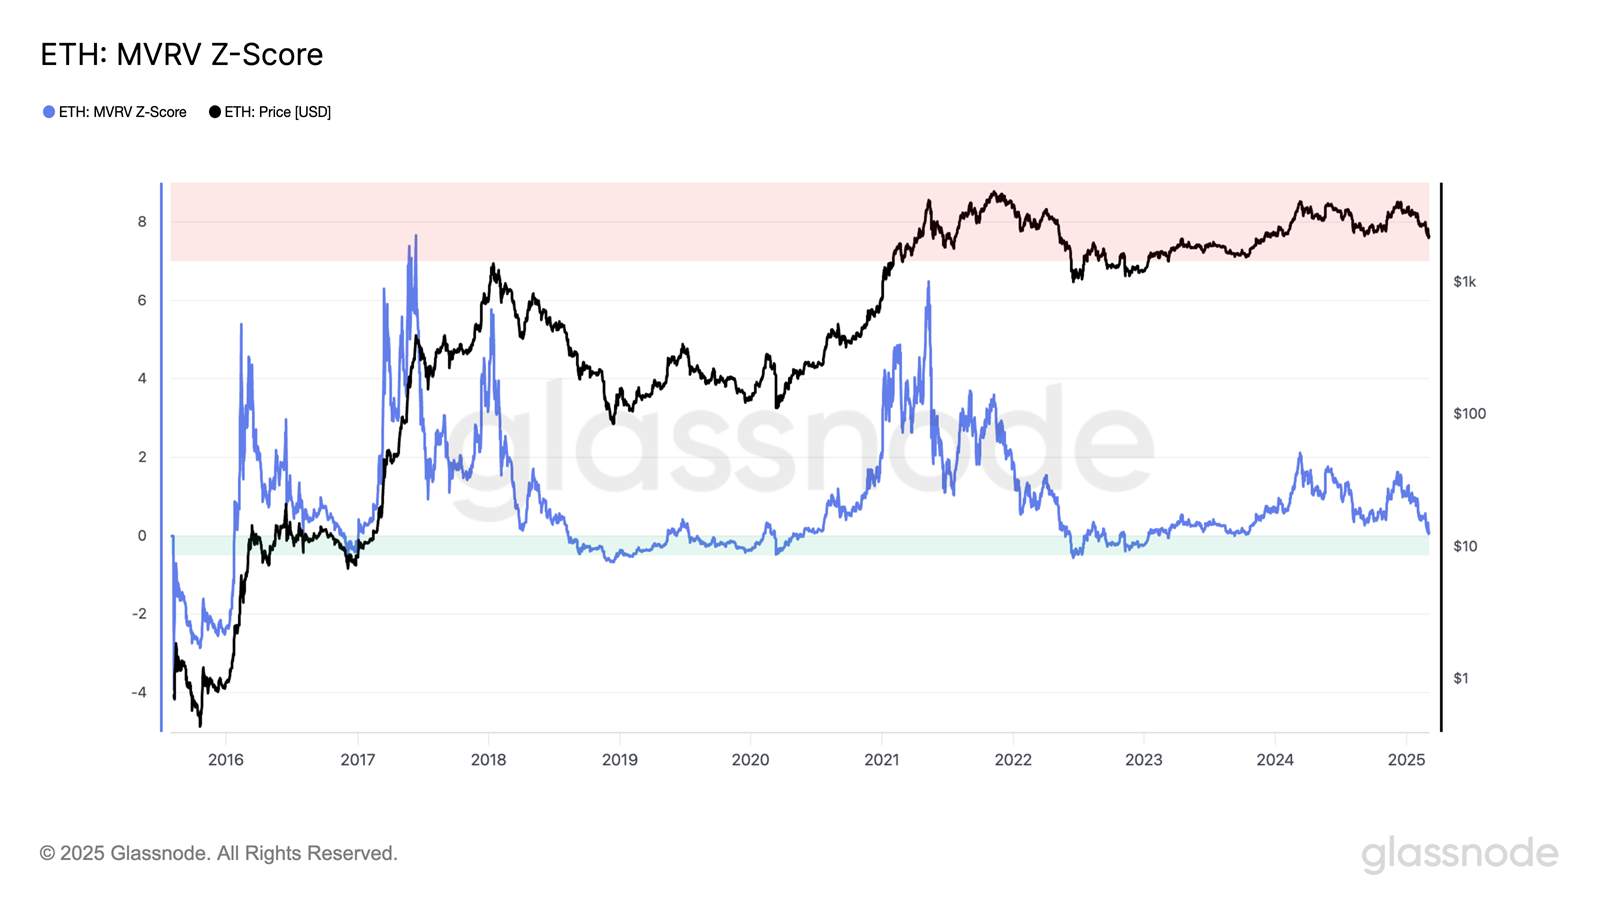
ETH MVRV Z-Score Performance Chart. Source: Glassnode
In fact, the last time the MVRV Z-Score bottomed out was in October 2023. ETH then rallied nearly 160%, approaching $4,000. Similarly, in December 2022 and March 2020, the index also fell into the green zone before ETH entered strong bull cycles.
Data from CryptoQuant shows that the daily flow of ETH into accumulation addresses is at a multi-year high. This is a key signal, indicating that large investors and institutions are actively accumulating ETH during low price periods.
Ethereum Whales Step Up Buying
Another important factor supporting the ETH recovery thesis is the actions of whales. On-chain data shows that addresses holding between 1,000 and 10,000 ETH have been accumulating strongly since July 2024, when Ethereum-specific ETFs will officially launch in the United States.
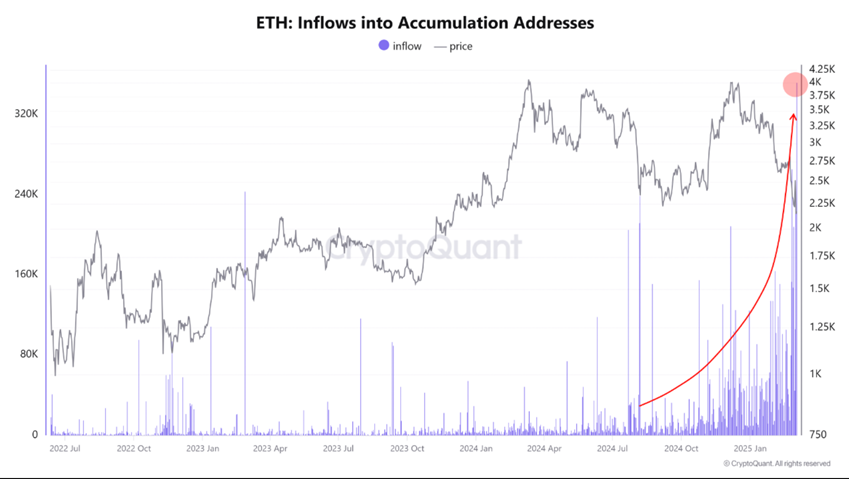
ETH flows into accumulation addresses. Source: CryptoQuant
This trend shows the strong belief of institutional investors in Ethereum’s future upside potential, especially when the coin is trading at a price that is considered attractive.
Can ETH Reclaim $4,000 by 2025?
As of March 6, ETH is trading around $2,291, testing a key support zone at the lower trendline of the symmetrical triangle and the 200-week EMA at $2,294.
If ETH can hold this support zone, the recovery scenario will become increasingly stronger. History shows that similar confluences often precede major trend reversals, pushing ETH towards the upper trendline of the triangle pattern around $3,650.
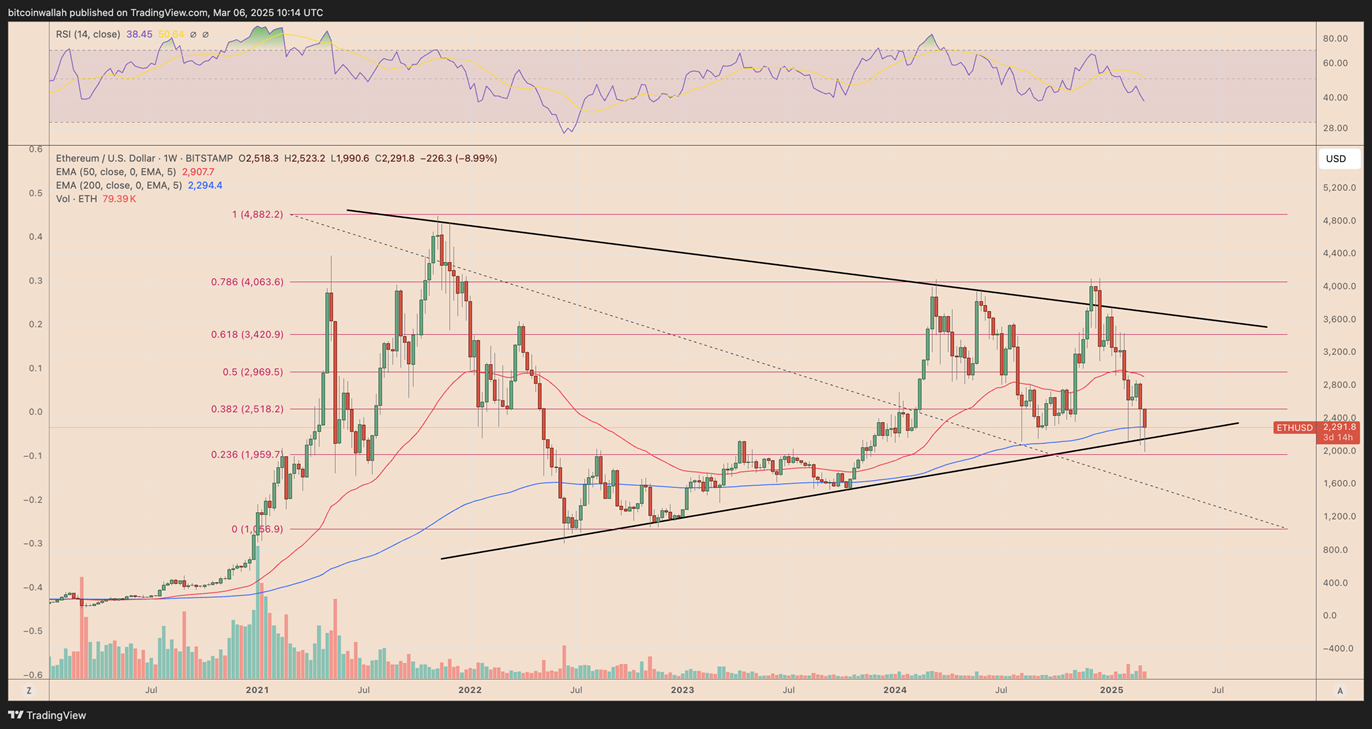
ETH/USD weekly price chart. Source: TradingView
Fibonacci analysis shows that key resistance levels for bulls include:
- The 0.382 Fib level (~$2,518) – the first major hurdle to overcome
- The 0.5 Fib level (~$3,000) – opens the door to further gains
- The 0.618 Fib level (~$3,420) – a historical resistance zone
- The 0.786 Fib level (~$4,063) – a key level for ETH to return to the $4,000 region
However, if ETH breaks below the current support zone, a negative scenario could occur. ETH could then fall further to $1,050, which corresponds to the 0.0 Fibonacci retracement level.
Conclusion
Ethereum is at a critical juncture as the MVRV Z-Score shows signs of undervaluation. On-chain data also confirms that institutional investors and whales are actively accumulating ETH, similar to previous bull cycles.
If ETH holds key support levels, the price could rebound strongly, heading towards key resistance levels and even returning to $4,000 by 2025. Conversely, if ETH breaks below key support levels, it could face the risk of a deeper decline.