Global financial markets continue to fluctuate amid investor sentiment being influenced by macro factors. Bitcoin price fails to hold the $94,000 level as selling pressure remains high. Meanwhile, the USD index (DXY) approaches an important support zone, while the S&P 500 is testing a key moving average to determine the next direction.
Bitcoin (BTC) Situation
Bitcoin price remains in the $93,388 - $100,000 range, showing a tug-of-war between buyers and sellers. The 20-day exponential moving average (EMA) slightly declined to $97,067, while the RSI indicator fluctuates around neutral levels.
BTC/USDT Daily Chart | Source: TradingView
If Bitcoin breaks the $93,388 support, selling pressure could push the price to $90,000, even risking a bearish double top pattern that could drag the price down to $85,000.
If Bitcoin breaks above $100,000, it could rally to $102,500 and then $106,500. However, a strong resistance area at $109,588 could slow the upside momentum.
Data from Glassnode shows that Bitcoin's 1-week realized volatility has dropped to 23.42%, suggesting a potential sharp move could be in the offing.
S&P 500 (SPX) Tests Support
After hitting an all-time high of 6,147 on February 19, the S&P 500 has fallen below 6,128 and continues to be under selling pressure.
SPX Daily Chart | Source: TradingView
If the price stays above the 50-day SMA at 6,008, the index could recover and head towards 6,403.
Conversely, if it closes below 6,008, the SPX could continue to trade in the 5,853 - 6,128 range in the short term.
USD (DXY) and Investor Sentiment
The DXY is approaching the 105.42 support zone, with the 20-day EMA at 107.36 tilting to the downside.
DXY Daily Chart | Source: TradingView
If the price fails to hold the 105.42 zone, selling pressure could drag the index lower.
A bounce above the 20-day EMA would put DXY back in an uptrend, with the next target at 108.
Ethereum (ETH) Weakens Ahead of Resistance
Ethereum failed to break above $2,850 on February 23, indicating increased selling pressure at higher levels.
ETH/USDT Daily Chart | Source: TradingView
If ETH stays below the 20-day EMA ($2,765), the price could drop to $2,600 and even $2,500.
To confirm the uptrend, the price needs to break above the downtrend line, with recovery targets at $3,450 and $3,750.
XRP Facing Support Breakdown
XRP has fallen below the 20-day EMA ($2.61) and is approaching the support zone of a symmetrical triangle pattern.
Biểu đồ XRP/USDT hàng ngày | Nguồn: TradingView
If the price breaks this support zone, it could fall further to $1.77.
Conversely, if bulls successfully push the price back above the moving average, XRP could remain in the triangle for longer.
BNB struggles around key support
BNB trades in a tight range between the 50-day SMA ($664) and the $635 support.
Biểu đồ BNB/USDT hàng ngày | Nguồn: TradingView
A break above $635 could see the price drop to $596.
A break above $664 would keep the price in the $635-$745 range for some time.
Solana (SOL) Tests $155 Support
After failing at $175, Solana is under selling pressure with the 20-day EMA sloping down at $184.
Biểu đồ SOL/USDT hàng ngày | Nguồn: TradingView
If the price fails to hold $155, it could drop to $133.
A bounce above the 20-day EMA would see the price return to the $175-$206 range.
Dogecoin (DOGE) Resumes Downtrend
DOGE is testing the support line of the descending channel pattern.
Biểu đồ DOGE/USDT hàng ngày | Nguồn: TradingView
If this support is lost, the price could fall further to $0.15.
A breakout above the 20-day EMA ($0.26) could help DOGE recover to $0.30.
Cardano (ADA) faces strong selling pressure
ADA failed to clear the 20-day EMA ($0.78) on February 23 and is at risk of falling to the channel support line.
Biểu đồ ADA/USDT hàng ngày | Nguồn: TradingView
If the price stays below $0.73, a drop to $0.50 is possible.
A bounce above the 20-day EMA would help the price head towards $0.88.
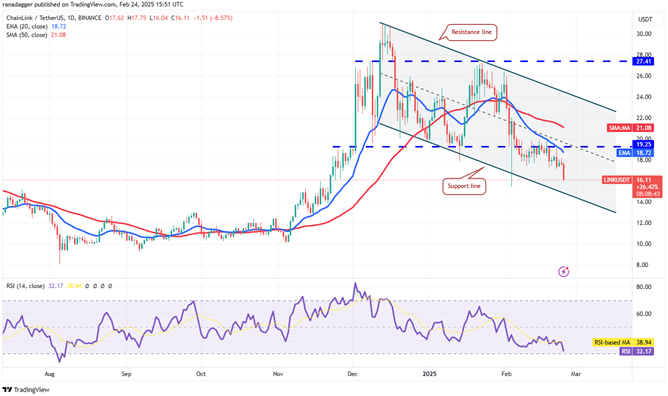
Chainlink (LINK) Resumes Downtrend
LINK lost the $17.28 support on February 21 and is approaching the descending channel support.
Biểu đồ LINK/USDT hàng ngày | Nguồn: TradingView
If the price breaks this support, a drop to $13 is possible.
A break above the 20-day EMA ($18.72) would put LINK back in an uptrend with a target of $21.08.
Conclusion
The market is in a critical phase with many assets approaching strong support levels. Bitcoin needs to break above the $100,000 zone to confirm the uptrend, while altcoins such as ETH, XRP, BNB, and SOL are under selling pressure. Investors should keep a close eye on key support levels to determine the next trend.